Product Description
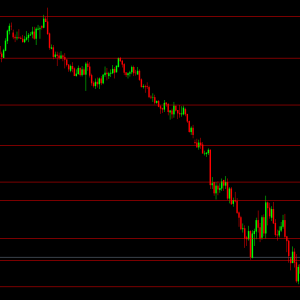
The Horizontal Line Drawer is a script that will draw a set of horizontal lines and an optional zone around them given a comma delimited list of prices entered by the user. This tool is great for those paying attention to commentaries and/or follow other traders’ SR levels and need to quickly enter precise price points for support and resistance. As you may know, it can sometimes be difficult to move a line to the exact price you want it at, especially on the higher time frames.
PARAMETERS AND USAGE
- PricePointList: enter a single price or multiple prices separated by a comma (or Delimiter if you change the default).
- Delimiter: the delimiter for the prices in PricePointList. If you don’t know what this means, ignore this parameter. It’s only useful in a very small amount of cases, such as if you receive a list of prices separated by a semicolon and wish to copy and paste.
- LineWidth: line width for the main support/resistance line. Valid values are 1 to 5 (integer).
- LineStyle: line style for the main support/resistance line.
- LineColor: line color for the main support/resistance line.
- LineNamePrefix: the prefix for all chart object names created by the indicator. If you don’t understand what this does, ignore this parameter.
- UseZone: if set to true, the script will draw a support/resistance zone around the line given the ZoneRangePips. For example, if one of the price points is 1.1265 and the ZoneRangePips is set to 10, two lines will be drawn 5 pips (10/2) above and below the price point (1.1260 and 1.270).
- ZoneRangePips: the range in pips to draw the zone above and below the horizontal line. Valid values are non-zero decimals.
- ZoneFill: if set to true, the script will fill in the entire zone range.
- ZoneColor: the color of both the zone lines and range.
- ZoneLineWidth: line width of the outer zone lines.
- ZoneLineStyle: line style of the outer zone lines.
